The Australian ski season goes from June to October but be
aware that Australian snow falls are highly variable, as
illustrated in the first graph. The good news is that,
averaged over several years, the snow falls do not seem to
be getting worse and a very good dump seems to occur every
few years. Picking, in advance, which years are "good" seems
impossible. However, just like going to the horse races, it
pays to know the "odds" that a particular week of the year will be good -
that's what this site is about - averaging the conditions
over many years. The third graph gives
these odds.
Ski Helmets - a buyers guide (thanks Tom Gibson). American Academy of Orthopaedic Surgeons: Position Statement - Helmet Use in Skiing and Snow Boarding
As a rough guide, the ski resorts are conditions are:
Links (sorry if some no longer work )
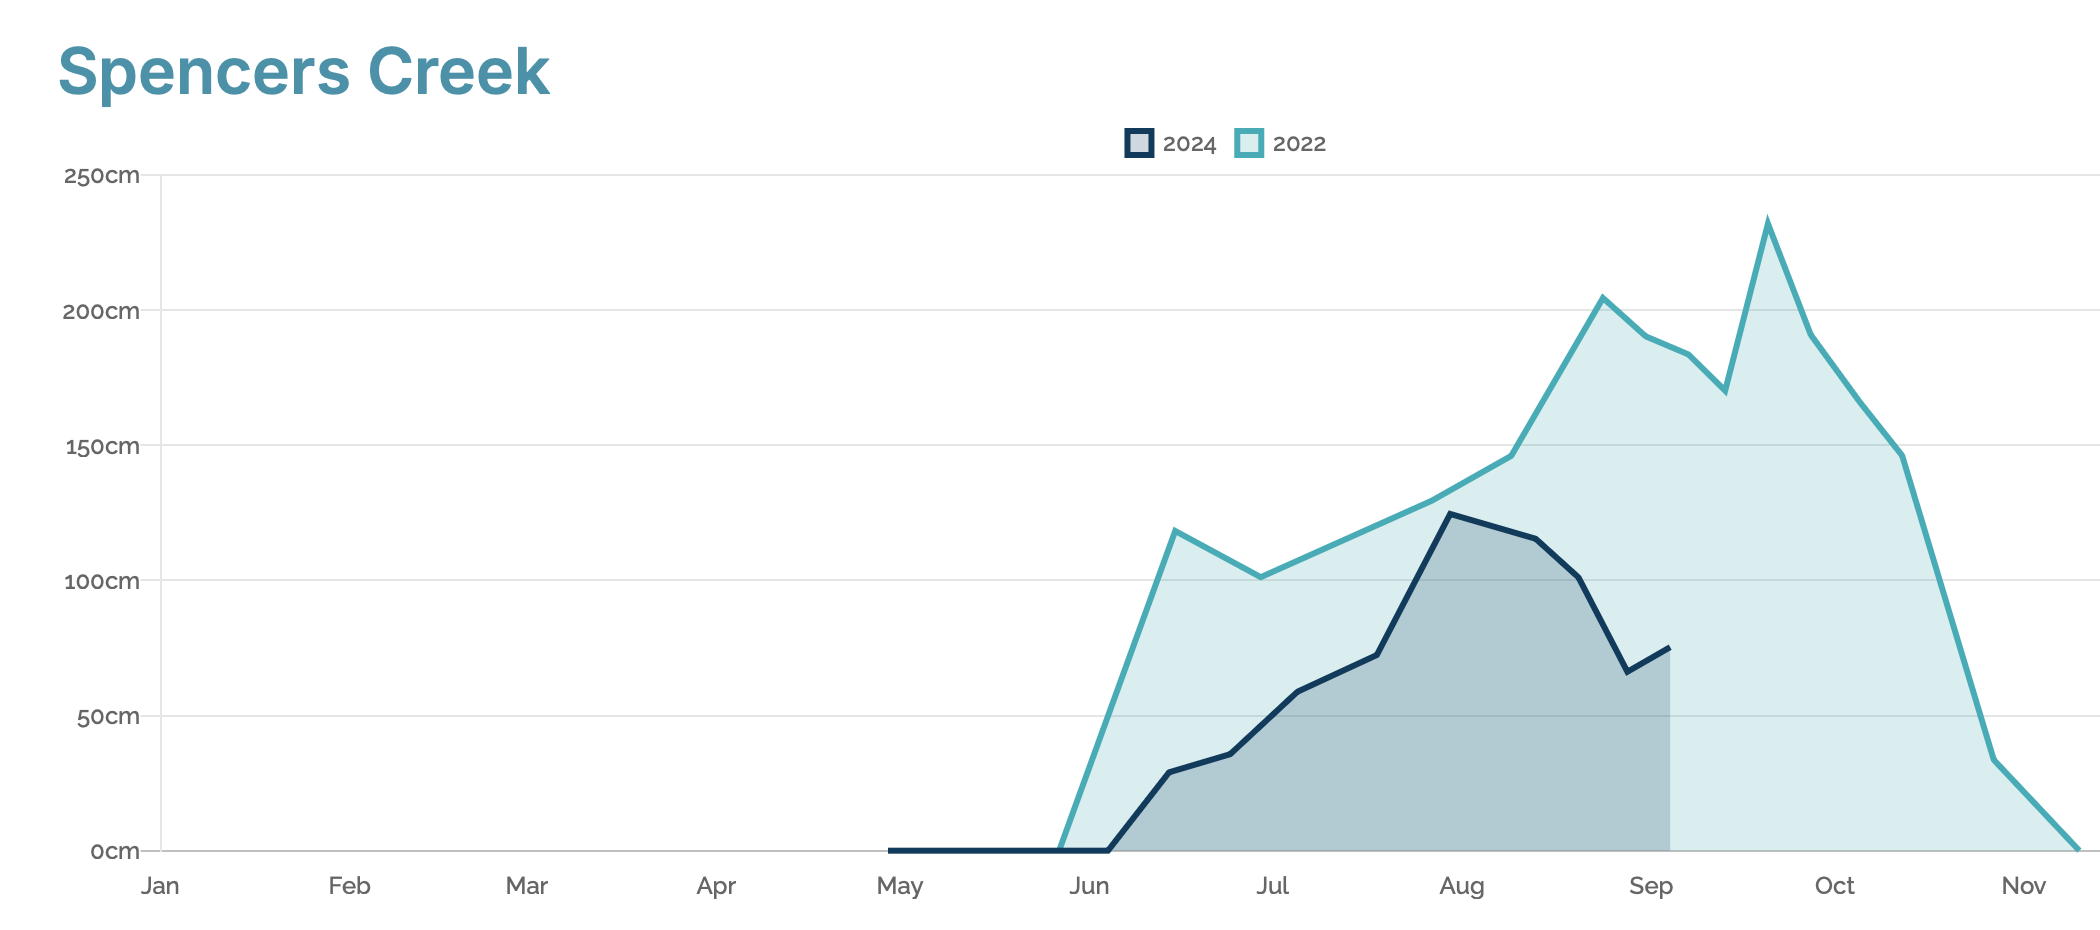
Graphs of Snow Depth at Spencers Creek (not the ski
fields)
Key
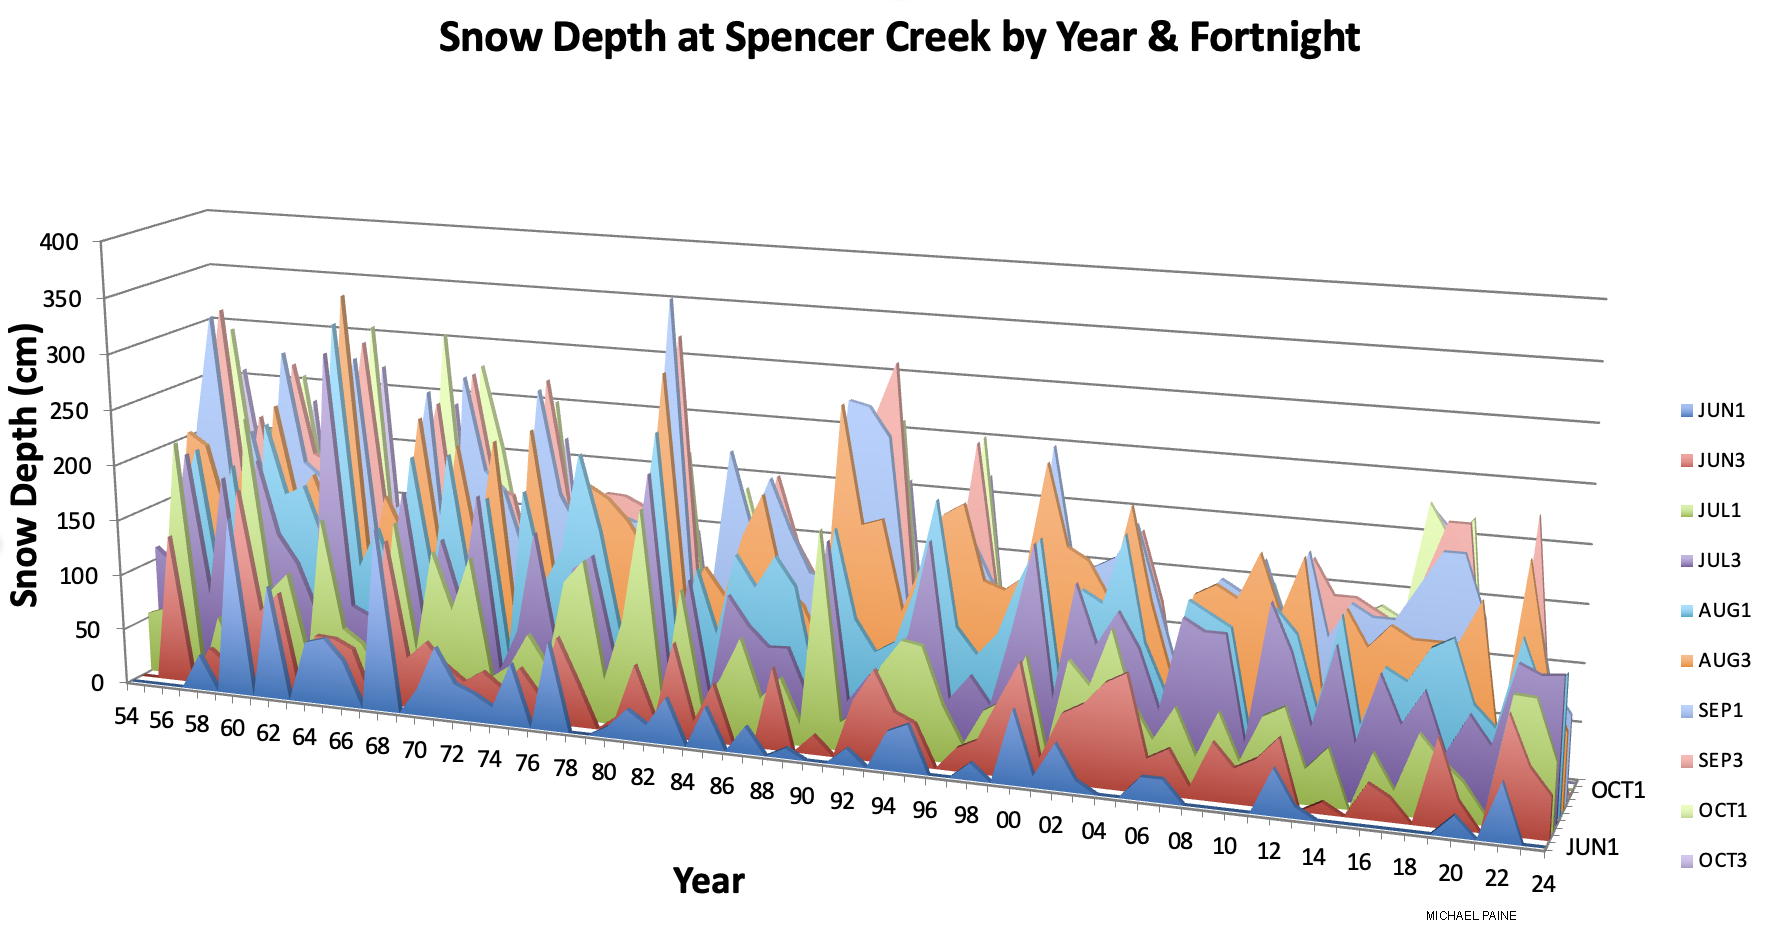
Snow depth by year and month - 3-D graph
The first graph is not a 3D model of the
Snowy Mountains! It shows the depth of snow (cm) by time of
year over the period 1954-2012. The left axis is month,
starting at the back with June and ending at the front with
October. JU1 stands for the first week in June, JU3 stands
for week 3 in June. The right axis is year, starting with
1954 on the left and ending with 2024 on the right.
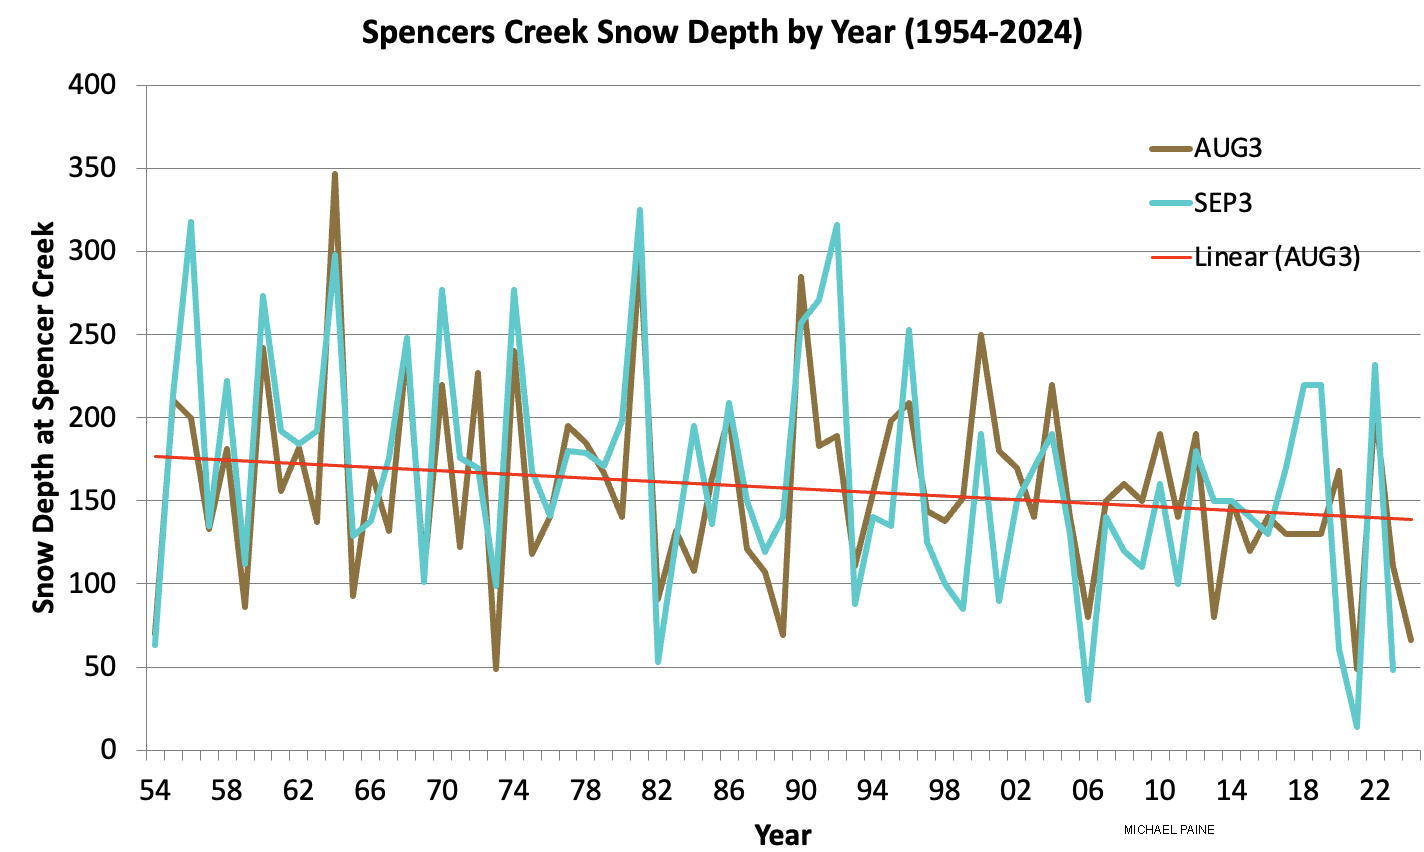
Snow depth for August and September by year
This graph shows the depth of snow in the middle of August
& September respectively (3rd week), over the period
1954-2012. The year to year variations are very evident in
this graph. They do not seem to be predictable! The linear
trendline shows no noticeable change to the avarage depth
during August over the decades. But the peaks seem to be
getting lower!
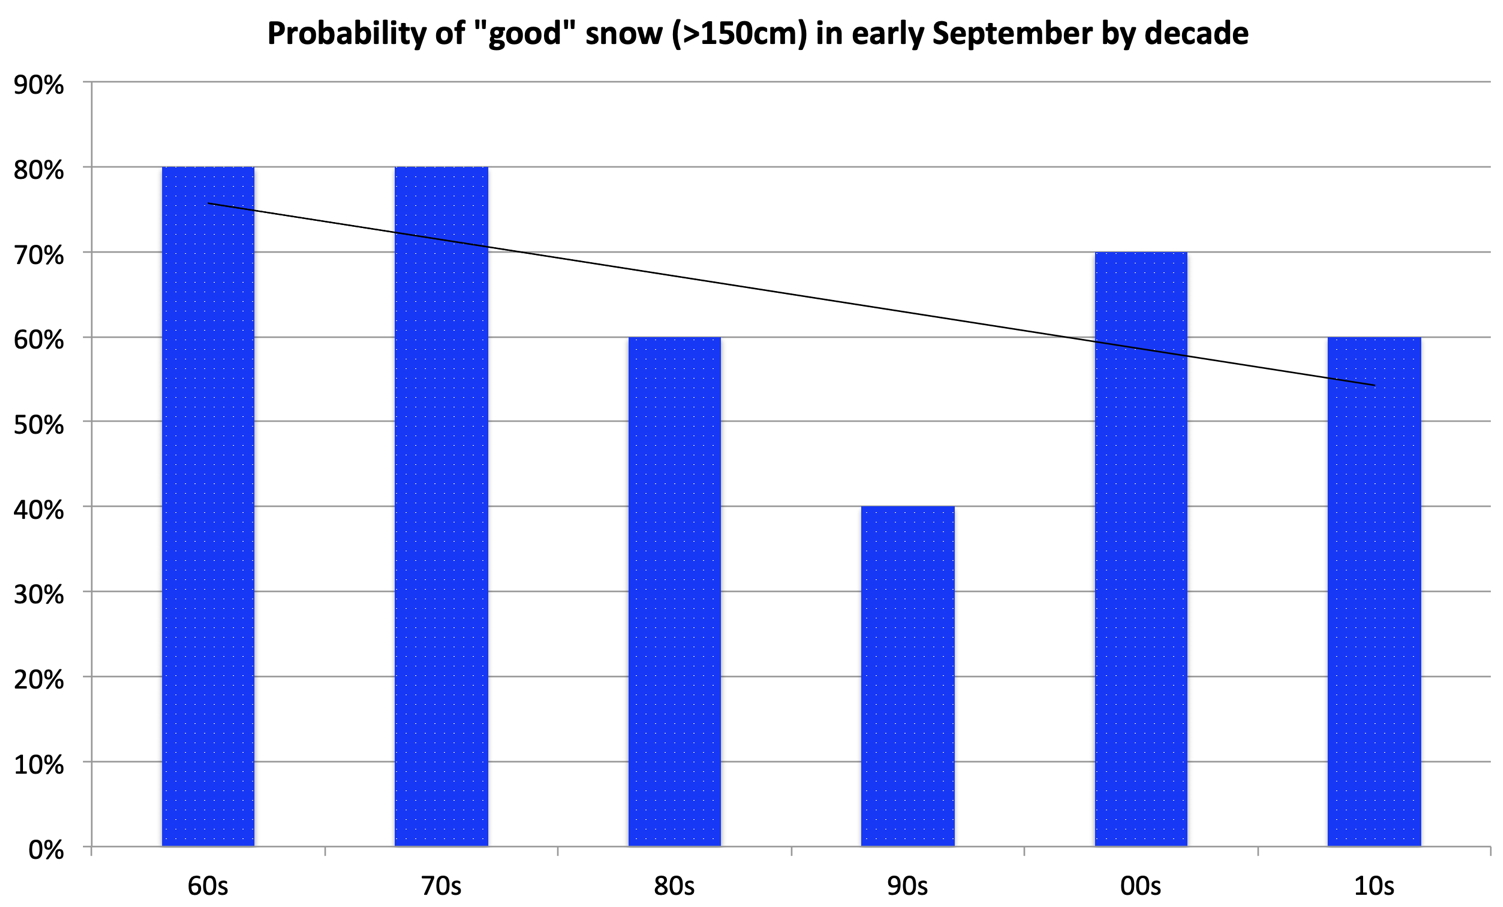
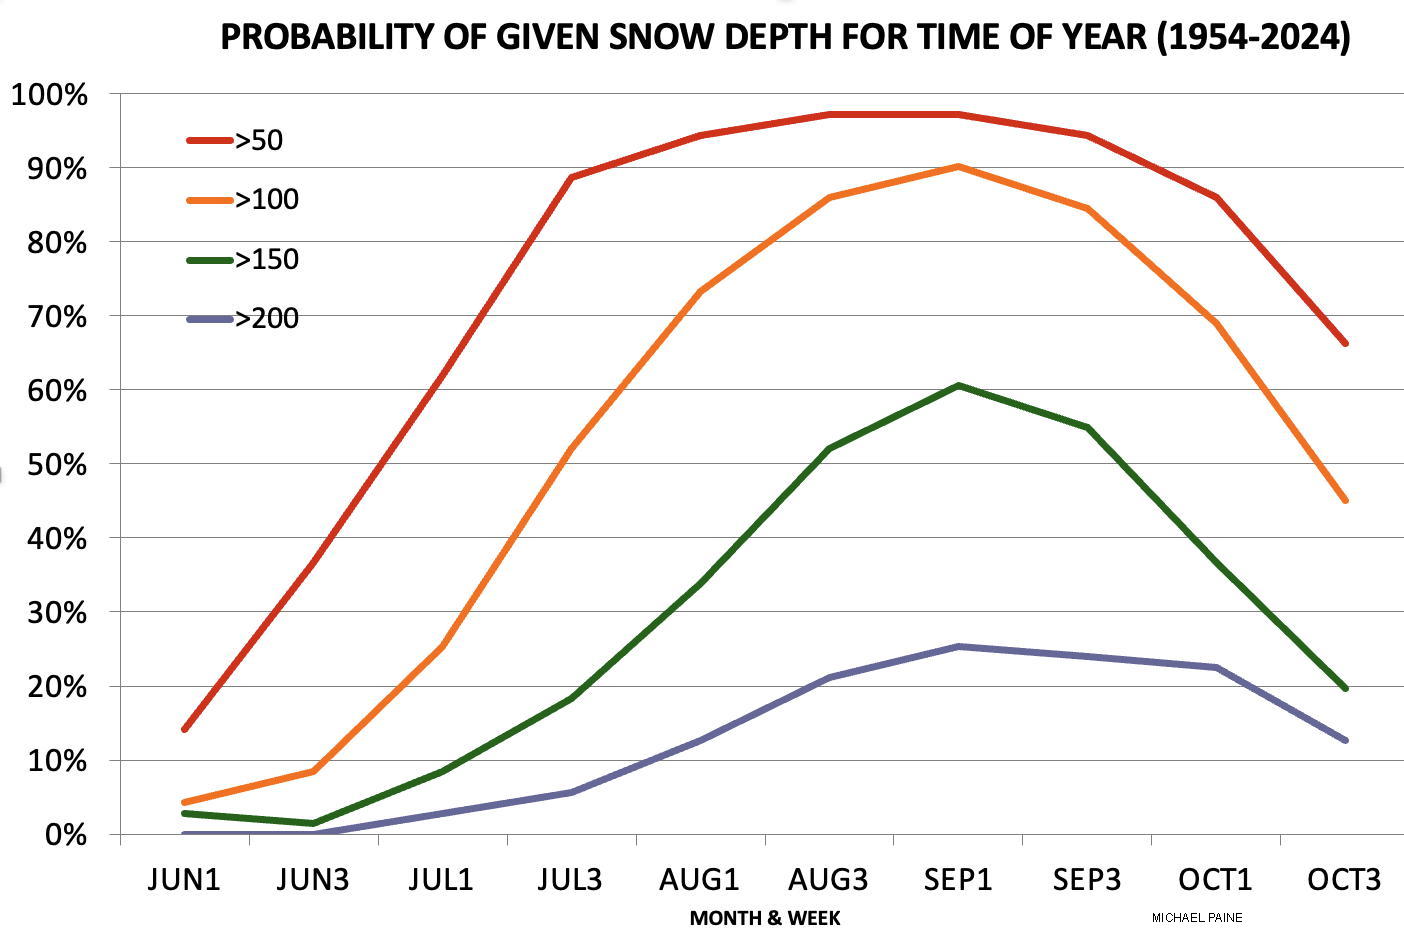
Probability of given snow depth by time of year
This graph shows the probability of certain depths of snow
by time of year. For example, in the third week of August
(AUG3) there is about a 55% chance of a snow depth exceeding
150 cm (green curve) and a 87% chance of a snow depth
exceeding 1 metre (red curve). These values are based on the
number of years where the given snow depth is equalled or
exceeded, out of the total of 59 years of data. So if
20 years during this period equalled or exceeded a depth
100cm the probability is 20/59 = 34%. This does not take
account of any change in trends in recent years.
Subject to the high variability and small sample sizes,
a good snow fall in mid-June did suggest a good season. For
the period 1964 to 1995, of 11 years where there was 50cm or
more in mid-June there were 7 years where the snow exceeded
150cm in late August (64% of 11). Of the 21 years where the
snow was under 50cm in mid-June there were also 7 years
where snow exceeded 150cm in late August (33% of 21). In
other words, there is twice
the chance of good snow at the peak of the season if there
is reasonable snow in mid-June!
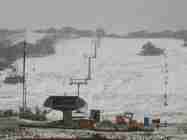
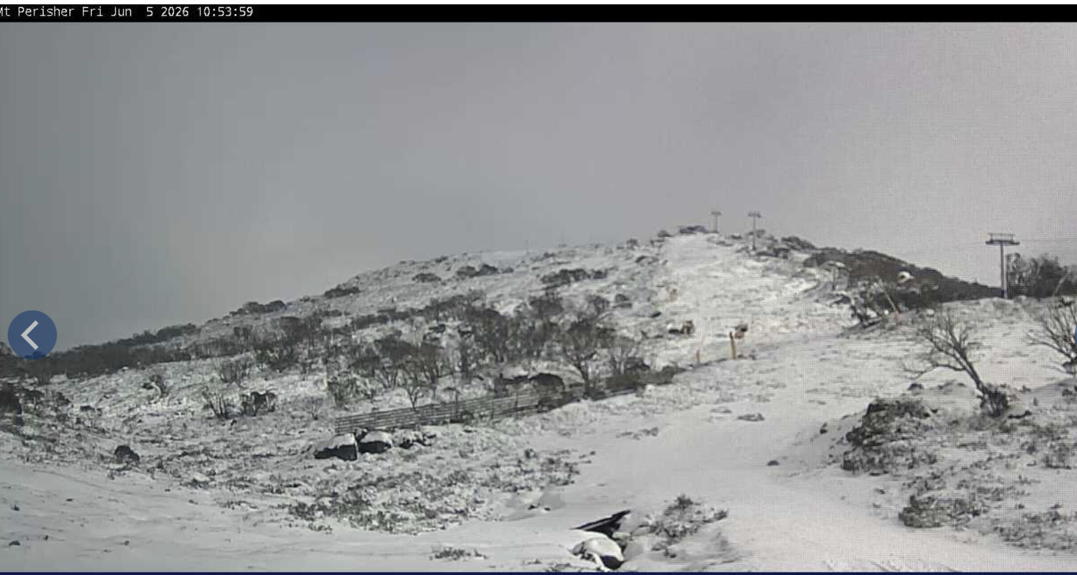
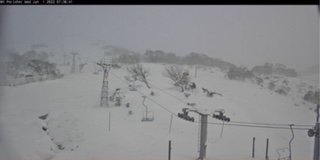
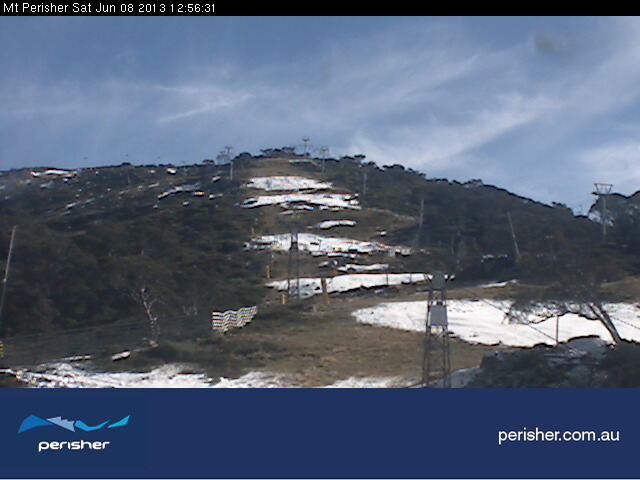
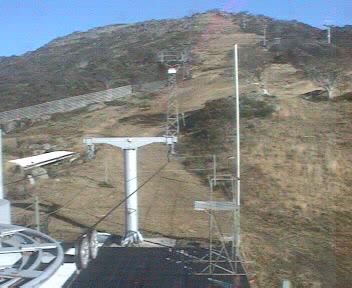
Below
are
some snapshots of Mt Perisher in late May or early June
over several years.
2026 - 5th June - a
promising start!
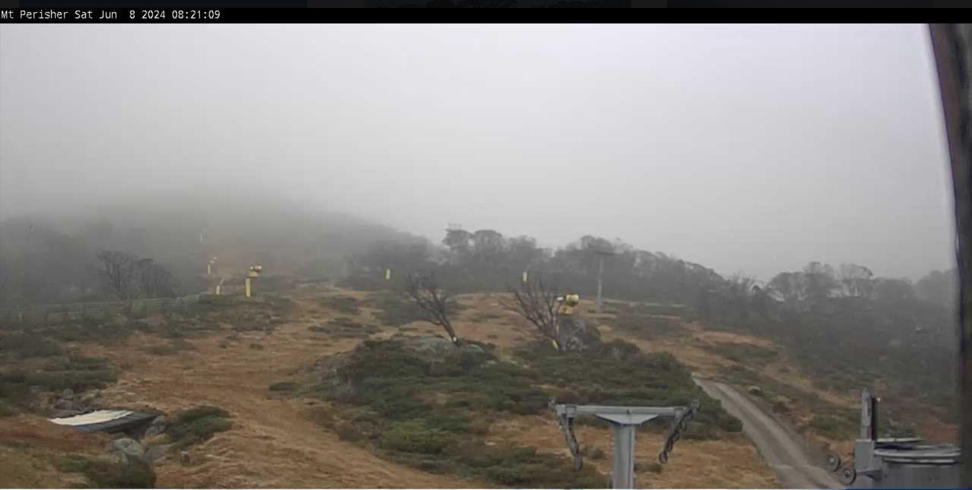
2024 - 8th June
2022 - 1st June
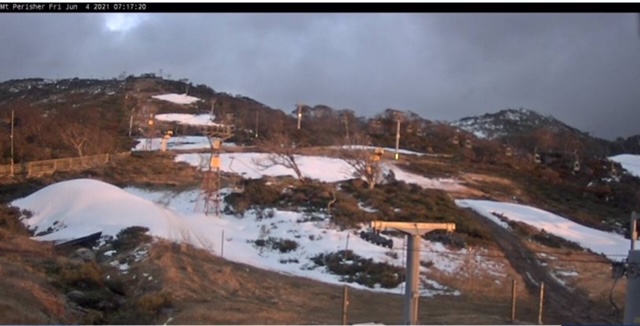
2021 - 4th June!
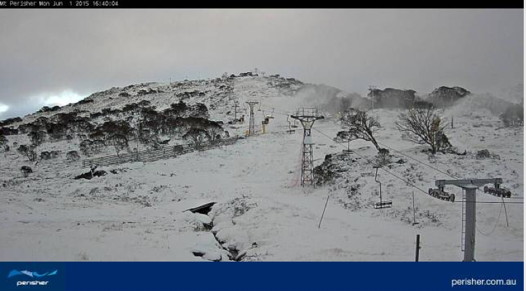
2015 - 1 June - a promising start to the season
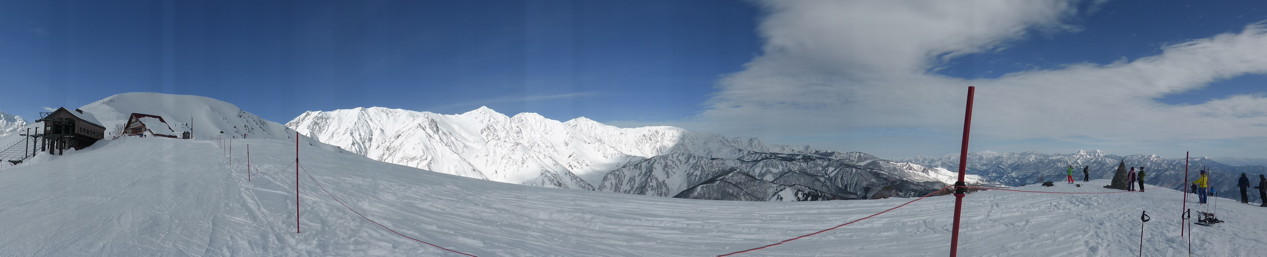
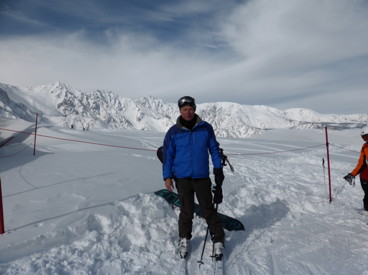
However, I have been spoilt by conditions in Hakuba, Japan (Jan 2015):
2013 - 8 June
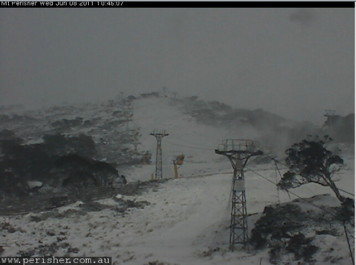
2011 - 9 June
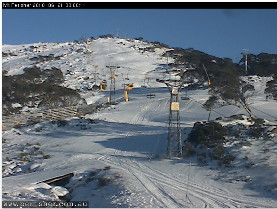
2010 - 21 June - promising start!
2009 - 5 June
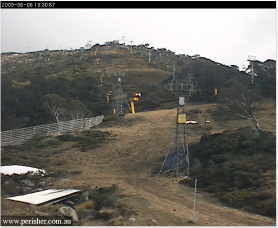
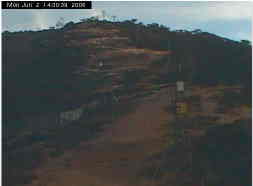
2008 - No sign of snow!
The Age 4 May 08: High hopes for bumper ski season
2007 - Patchy but cold
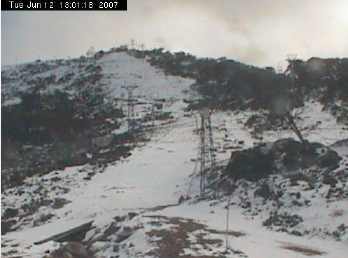
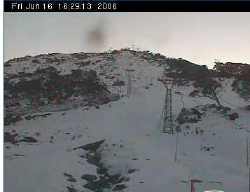
2006 - Promising in mid June!
Update 2 Aug 06: BUT... with a snow depth of less than 0.6m
at Spencers Creek at the start of
August it is in the running the worst season since
1973. Update: sure was!
2005 - Like a mid-summer day!
2 Jun 05: This year SE Australia experienced one of its
warmest, driest autumns on record. Let's hope it doesn't
continue through winter.
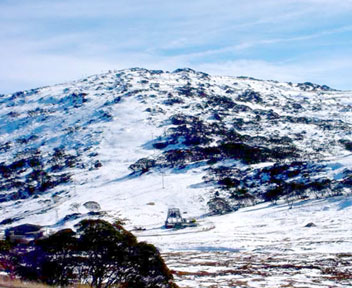
 A view of Mt Perisher on 25 May 2001. Looks good
for mountain goats!
A view of Mt Perisher on 25 May 2001. Looks good
for mountain goats!

Unfortunately warm weather and rain ruined things from early September 1999.
Finally, don't blame me if the snow is no
good!
by Michael Paine (home)
Last update late 6 Sep 2024.
This page awarded AAA
Top1%
of the WEB September 1996!
![[home!]](myhome1.jpg)