Simulation of Asteroid/Comet Impacts with Earth

[TPSAVC Site map]
The Planetary Society (USA)Home page for the Australian Volunteer Co-ordinators  Join TPS Tribute to Carl  SaganComments on Planetary ScienceHow microbes might hitch a ride between planetsCarl Sagan's Baloney Detection KitThe Search for Extraterrestrial IntelligenceThe search for Earth-threatening comets and asteroidsProposal to revive the Australian Spaceguard ProgramTsunami (Correspondence with politiciansTPSAVC Home (of course!)
 

Simulation 1046: One million years looking at worst event each century.
By Michael Paine 6 Jan 2000

[Freq of  events] [Impactor diameter] [Fatalities by impactor diameter] [Distribution of fatalities] [(Low) Freq of craters]

This page provide further information about the simulation described in my Explorezone/Space.com article "SIMULATING ARMAGEDDON ON YOUR PC: ASTEROID IMPACTS WITH EARTH".
If you have a copy of the software check out, and contribute to, the Users Page.

The computer program is available on diskette distributed with the book "Comet and Asteroid Impact Hazards on a Populated Earth" by John S. Lewis, Academic Press. It was released late in 1999. See review.

Due to its random nature, each time the program is run it generates a completely different set of results. The overwhelming influence of a few horrendous events means that the total number of fatalities can vary considerably between successive runs.

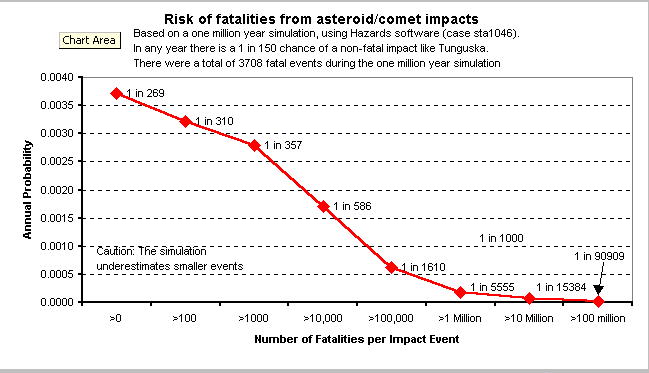
Set out below are the results of a total of one million years of simulation, looking at the worst event in each of 10,000 centuries. I want to stress that these are NOT predictions and that no known NEOs are on a collision course with Earth.

Although one million years seems a very long time, bear in mind that impacts do not run like clockwork - they could occur at any time. An event which happens once in one million years of the simulation has a one-in-a-million chance of happening in the next twelve months. This should not be dismissed as unimportant, particularly if it could involve billions of deaths and the end of civilisation. After all, many optimistic people around the world regularly buy lottery tickets where the chance of winning first prize is one in 30 million or worse. The chance of getting dealt a royal flush in 5 card poker is about one in half a million.

In my simulation the total death toll during one million years was 7.5 billion. This represents an average of 7,500 fatalities per year and is higher than the 3,000 fatalities per year generally quoted by scientists. However, nearly half of these fatalities occurred in one devastating event that wiped out half of the world's population - a possible outcome in the real-life gamble with rocks from space.
To put the NEO death toll in perspective, it lies somewhere between that of earthquakes (10,000 per year) and airline crashes (700 per year).

Only the worst event in each century was considered in my simulation. Other fatal events may occur but are not included in the death toll. The death toll from smaller NEOs is therefore an under-estimate. See the 10,000 year simulation looking at the worst event in each decade for the influence of smaller impactors.

The original program uses a tsunami runup factor of 30 (the height of the wave at the shoreline was assumed to be 30 times the height of the wave in deep water). A more conservative runup factor of 5 was used in the simulation.

The program is mainly intended for runs covering a several thousand years. In these time periods impacts massive enough to cause global climatic trauma are extremely rare and the program did not fully account for these effects. Lewis and others suggest an explosion equivalent to one million megatons of TNT would be sufficient to cause over a billion human fatalities, mainly due to global starvation. A typical asteroid about 1 mile across would do the trick. Global climatic effects probably become insignificant for asteroids smaller than 500 yards across, with a typical explosion of 10,000 megatons of TNT (some 200 times larger than an H-bomb). The potential fatalities from these climatic effects have been included in the following fatality estimates.

Asteroid/comet diameter is estimated from mass (randomly generated by the program) and density (derived from the type of object - also randomly generated).

A constant world population of 5 billion people is assumed. It is also assumed that impacts occur without warning (the current situation) and that there is no time for evacuation or preparation, such as stockpiling of food supplies.

Summary Data

Size of asteroid/comet
ASTEROID DIAMETER

(m or km)

No. OF EVENTS No. OF FATAL EVENTS % FATAL TOTAL

FATALITIES

AVERAGE FATALS PER YEAR * AVERAGE FATALS  PER FATAL EVENT ANNUAL RISK OF FATAL EVENT

1 in ...

AVERAGE YIELD PER FATAL EVENT (Mt of TNT)
0-99m
8563
2619
31%
240 million
240
92,000
382
30
100-199m
1065
736
69%
230 million
230
310,000
1359
300
200-499m
311
295
95%
530 million
530
1.8 million
3390
3,900
500-999m
45
44
98%
620 million
616
14 million
22727
29,000
1-1.9km
14
14
100%
2.5 billion
2500
180 million
71429
220,000
2km+
2
2
100%
3.5 billion
3460
1.7 billion
500000
2,000,000
All
10000
 3710
37%
7.6 billion
7576
2 million
270
2,600
* Under-estimate for small NEOs

Type of asteroid/comet
 
Type of impactor No. of events Fatals per year
"Weak" asteroid (CI, CM) 3075 (31%) 600 (8%)
Ordinary asteroids (H, L, U) 4135 (41%) 1265 (17%)
Stony irons (Pall, Meso) 71 (0.7%) 3 (0.04%)
Irons 132 (1.3%) 5 (0.07%)
Comet - short period 1289 (13%) 937 (12%)
Comet - long period 1298 (13%) 4722 (3060 from 1 event) (63%)

Type of event
 
Type of event No. of events Fatals per year
Ejected or captured 221 -
Slowed down (no blast) 4 139
Fragmented over land 2578 567
Fragmented over ocean 6225 <1
Impacted land 283 5160
Impacted ocean 689 1640

Cause of death
 
Cause of death No. of fatalities
Blast 188 million
Firestorm 520 million
Tsunami 92 million
Glass from buildings 32 thousand
Global climatic effects (starvation) 6.7 billion

Craters formed by land impacts
 
Diameter of crater No. formed over 1 million years
20km or more 2
10 to 19 km 5
5 to 9 km 24
2 to 4 km 146
1 km or less 106

Comment: Due to the effects of erosion, at the end of 1 million years perhaps 40 craters might remain. This is the only "hard" evidence that 3,710 fatal events have occurred over that time. Craters on Earth are not a reliable indicator of the threat from asteroids and comets!

Graphs

Comments: This graph is quite sobering. It suggests that the chance of a fatal impact event occurring in any twelve month period is great than 1 in 300 (actually 1 in 270). The biggest risk is from objects under 100m in diameter. Even though most objects this size explode high in the sky in an "airburst", the typical yield is around that of an H-bomb and they can be devastating if they occur over a populated region. The Tunguska event of 1908 was in this group but fortunately was in an unpopulated region of Siberia.
Note the log scale of the Y axis.


Comments: This graph shows that the greatest risk, in terms of average fatalities per year, is from the rarer impacts by objects 1 kilometre or more in diameter. These are the objects most likely to be detected by a Spaceguard Survey. The rates for objects under 200m diameter are likely to be an underestimate because only the worst event in any one century is counted. These smaller NEOs are much more difficult to detect using Earth-based observatories.
Comments: This shows that the more frequent impacts by small NEOs (under 100m diameter) typically result in around 100,000 fatalities. The number of fatalities rises quickly as the object diameter increases (note the Y axis is a log scale). The averages are for fatal events only - non-fatal events are ignored.

Frequency of fatal events

FATALITIES          COUNT               P(ANNUAL)           RISK
>0                           3708                        0.003708        1 in 269
>100                       3221                        0.003221        1 in 310
>1000                     2800                        0.002800        1 in 357
>10,000                  1705                        0.001705        1 in 586
>100,000                621                          0.000621        1 in 1610
>1 Million                180                          0.000180        1 in 5555
>10 Million              65                            0.000065        1 in 15384
>100 million            11                             0.000011        1 in 90909
Comments: The annual odds of an event with more than 100 million fatalities are about 1 in 90,000. This is similar to the death toll from WWII and much greater than any natural catastrophe.
It is speculated that even a one million fatality event ( 1 in 5555 annual risk) anywhere on Earth would be quite devastating for our civilisation.

The obvious question from these results is where are all the craters?
The answer is that most fatal events do not leave a crater - they result from an ocean impact (with many of the fatalities due to tsunami) or Tunguska-like fragmentation over land. The proportion of fatal events that involve a land impact (li) gradually increases from less than 1% for events with around 100 fatalities to 16% for events with around 1 million fatalities (see table below).

In the case of this simulation it was just chance that 3 of the 4 events resulting in 1 billion plus fatalities occurred over land and would have left 3 large craters. Severe but transient global climate disturbance WITHOUT A CRATER can occur with large ocean impacts like Eltanin (2.2 Ma) or, perhaps, Indochina 800 Ka (Australasian tektite event).
 

Count of fatal events (over one million years of simulation)

Fatalities LF LI OF OI ALL % CRATERS
100 149 2 91 9 251 0.8%
1000 594 21 19 111 745 2.8%
10,000 856 72 1 295 1224 5.9%
100,000 494 110 0 181 785 14%
1 M 139 35 0 48 222 16%
10 M 25 13 0 37 75 17%
100 M 3 9 0 8 20 45%
1 B 0 3 0 1 4 75%
All 2260 265 111 690 3326 8%

Key
LF      fragmentation over land
LI      land impact (crater)
OF    fragmentation over ocean
OI     ocean impact (tsunami)

Average interval between fatal events that leave a crater: 3774  years
Average interval between fatal events:301 years

Conclusion: The cratering probability (1 in 3800 per year) is similar to the probability of events with 1 million fatalities (1 in 5500 per year) . The apparent lack of recent craters on Earth is not a reliable indicator of the threat from asteroids and comets!